How to implement Business Intelligence in a company, step by step
What Business Intelligence is and how to implement it in seven steps: sources, definitions, data layer, reconciliation, dashboards, alerts and adoption.
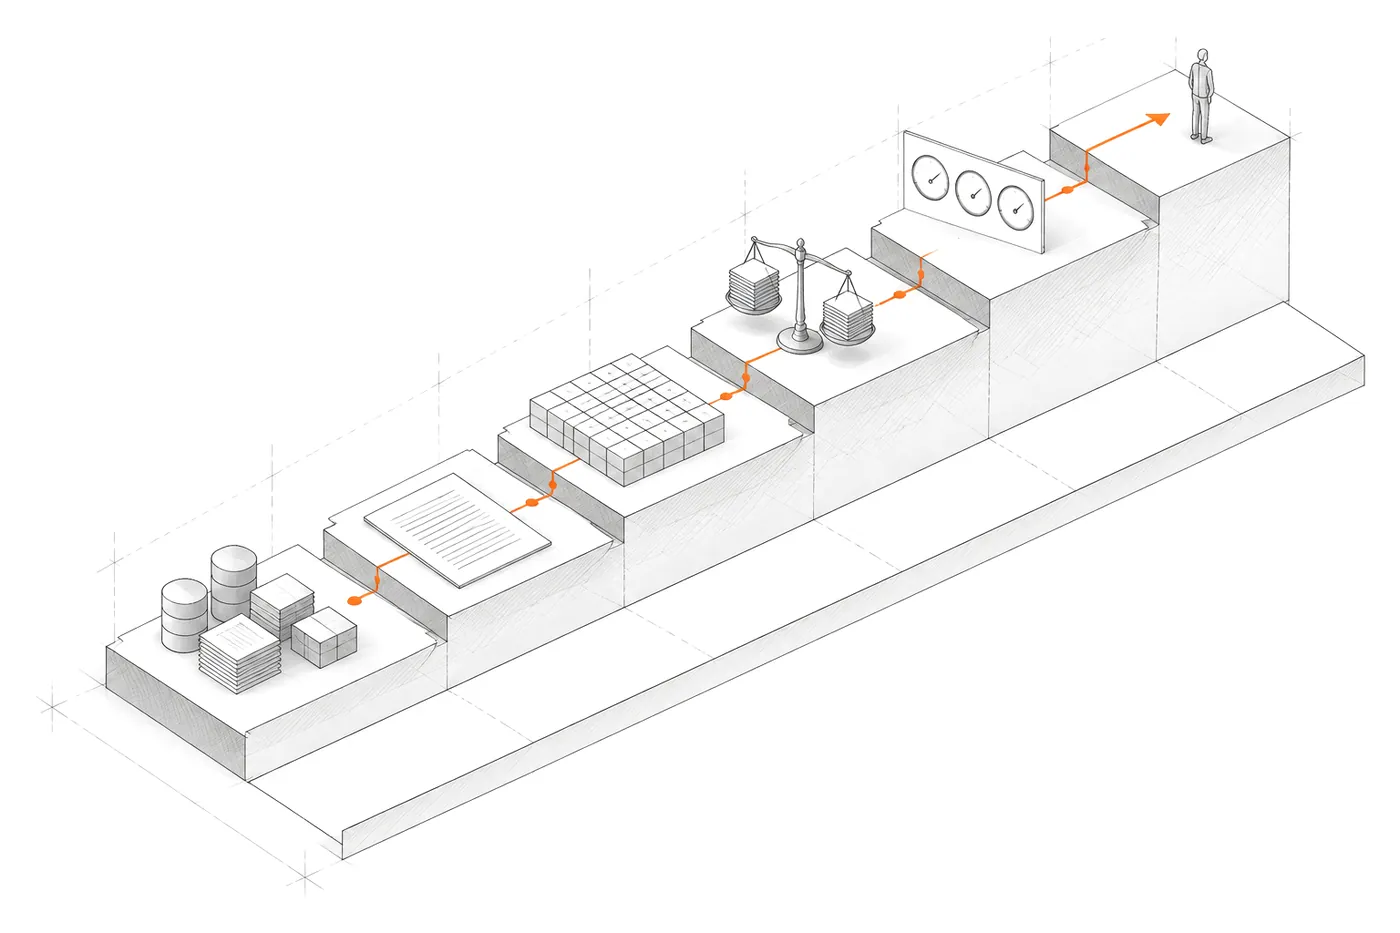
Implementing Business Intelligence in a company means turning the data it already has into reliable answers for decision-making: you inventory the sources, define what each piece of data means, build a data layer, reconcile the figures with their origin and only then draw dashboards and alerts. Order matters. Most BI projects that fail start at the end: with the tool and the charts.
It’s easy to see why. A BI tool installs in an afternoon and shows charts on day one. Definitions, reconciliation and adoption don’t shine in a demo. But they decide whether, six months later, anyone trusts the figures.
What Business Intelligence is (without the textbook definition)
Business Intelligence is the set of processes and systems that turn a company’s operational data into information for decisions. In practice it has three layers:
- At the bottom, the sources: the ERP, the CRM, the operations database, the spreadsheets.
- In the middle, the data layer: where those sources are read, what each field means and how metrics are calculated.
- On top, the surface: dashboards, reports, alerts and, increasingly, natural-language questions.
The tool (Power BI, Looker Studio, Metabase or a custom system) is only the top layer. What separates useful BI from decorative BI lives in the middle one.
How to implement Business Intelligence in seven steps
1. Write down the business questions
Before touching any data: what management wants to know every week, in their own words. “Which projects are at risk?”, “where is cost leaking?”, “which customers have stopped buying?”. No questions, no BI project yet.
2. Inventory the sources
Where each piece of data that answers those questions lives: which system, which table, who enters it and when. This is where the surprises appear: the data exists, but in a spreadsheet one person maintains, or it’s entered a week late.
3. Define every piece of data in writing
A data contract: what each table contains, what each field means (checked against reality) and with what caveats it’s used. “Active project” or “cost” seem obvious until three departments calculate them three different ways.
4. Build the data layer
Read the sources where they live, ideally read-only and without migrating systems that work. Moving to a separate data warehouse is a decision, not a requirement: it makes sense with many sources or when queries weigh too heavily on the original system.
5. Reconcile with the source
Check every metric with an independent method before showing it. If the hours in the report don’t match those in the source system, fix it now, not after management has decided on that figure.
6. Design dashboards and alerts
Now, yes: one metric per question, fair comparisons, the cut-off date visible and a list of what needs attention at the top. Alerts come with the evidence that triggers them. I go into more detail in how to design a Power BI dashboard management actually uses.
7. Support adoption
BI nobody opens doesn’t exist. In the first weeks, review what gets looked at, what gets ignored and which new questions come up. Often the best adoption is not having to open anything: a report that arrives ready every morning.
A real example: AtalayaIQ
AtalayaIQ is an intelligence layer over seven years of a national events company’s operational data. It followed these steps almost to the letter:
- Sources read where they live: the MySQL database of the system the company already used, with a read-only user. Zero writes to the original system.
- A data contract with the verified meaning and caveats of every table.
- Independent reconciliation: hours, costs and findings checked with hand-written SQL, plus 36 automated tests.
- Fair comparisons: each day against the previous day of the same type, at the same logging delay.
- What can’t be claimed, left out: budget, margin and revenue don’t appear, because the database doesn’t contain the data to calculate them.
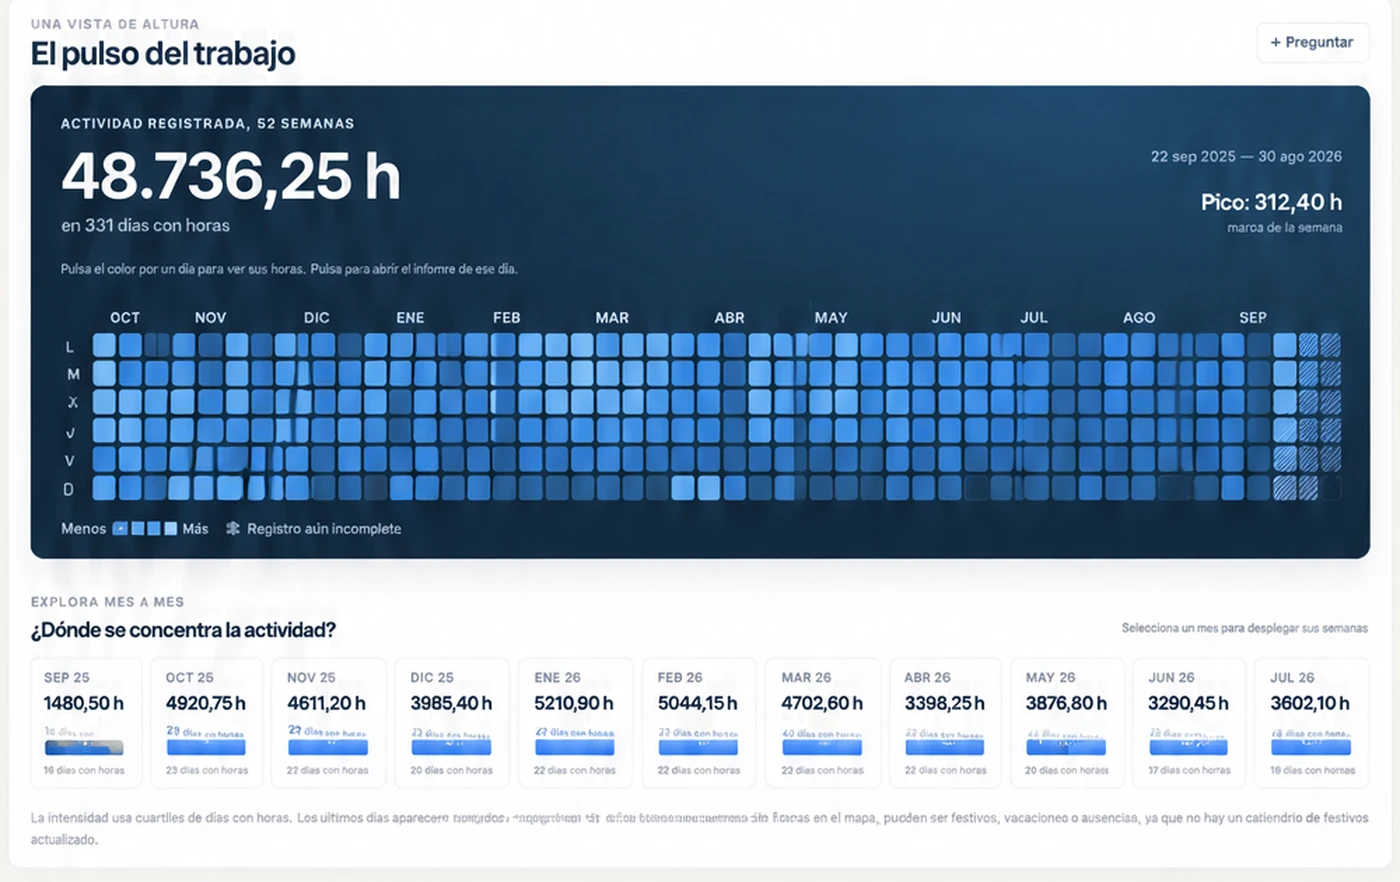
The result isn’t a catalogue of charts but a daily and weekly report with what matters, a prioritised action plan and alerts with their evidence.
Common mistakes when implementing BI
- Starting with the tool. Buying licences before knowing which questions to answer.
- Drawing before defining. A chart inherits the data’s ambiguity and makes it look true.
- Migrating everything “just in case”. A months-long project before a single question is answered.
- Not reconciling. The first wrong figure management spots destroys trust in all the others.
- Showing estimates as facts. If the margin can’t be calculated from the data you have, the dashboard doesn’t show it.
- Forgetting whoever enters the data. If the data isn’t recorded properly at the source, no BI will fix it.
Business Intelligence doesn’t start with a chart. It starts with a definition everyone agrees on.
Business Intelligence implementation FAQ
How long does it take to implement Business Intelligence?
It depends on the number of sources and how tidy the data is. What does pay off is answering one or two important questions early, within weeks, and growing from there, rather than waiting months for a complete project.
Do you need a data warehouse?
Not always. If there are few sources and the source system can handle the queries, it can be read directly, read-only. A separate warehouse pays off with many sources or heavy queries.
Is Power BI enough?
For the top layer, often yes. Power BI doesn’t solve definitions, reconciliation or the traps in the source data on its own: that’s the data layer’s job, whatever the tool.
Where does artificial intelligence come in?
At the end, once the data layer is reliable. In AtalayaIQ, an assistant answers questions about the report by choosing queries from a closed catalogue; it doesn’t write SQL or decide what counts as an alert.
If your company has data but doesn’t trust it, custom Business Intelligence explains how I approach it, and custom KPI dashboards covers the part management sees.