S.02 / BI

Custom Business Intelligence on the data your company already has.

I integrate the sources you already have, pin down what each piece of data means, reconcile it against its origin and turn it into metrics, alerts and reports management can use to decide.

Business Intelligence on existing dataERP, CRM, MySQL databases, Excel sheets and APIs are read into a layer of verified definitions that produces metrics, alerts and reports.01ERP02CRM03MYSQL04EXCEL05APISDEFINITIONSMETRICSALERTSREPORTSBusiness Intelligence on existing dataERP, CRM, MySQL databases, Excel sheets and APIs are read into a layer of verified definitions that produces metrics, alerts and reports.ERPCRMMYSQLEXCELAPISDEFINITIONSMETRICSALERTSREPORTS

02 / PROBLEM

The problem is almost never a lack of data.

The data is scattered, means different things to different people and nobody turns it into decisions.

Most mid-sized companies have years of activity in their ERP, their CRM and their spreadsheets. The data is there. What’s missing is agreement on what it means and someone who puts it in front of decision-makers, on time.

And operational data has traps: entries made days late, fields used for things they aren’t, half-closed periods. A report that doesn’t know about them publishes drops that don’t exist and growth that never happened, with complete confidence.

Custom Business Intelligence means solving that first (sources, meaning, verification) and only then drawing.

03 / SIGNALS

Your company has data, but no intelligence.

None of these signs is fixed by a new tool. They’re fixed with definitions and a layer that enforces them.

  1. 01Two departments present the same figure and it doesn’t match.
  2. 02There’s a database with years of activity that’s only ever used to look up a record.
  3. 03Nobody can say for sure what “cost” or “active project” includes.
  4. 04Month-end close starts by cross-checking exports from three systems.
  5. 05Management’s questions get answered “next week”.
  6. 06You bought a BI tool and reports are still made in Excel.
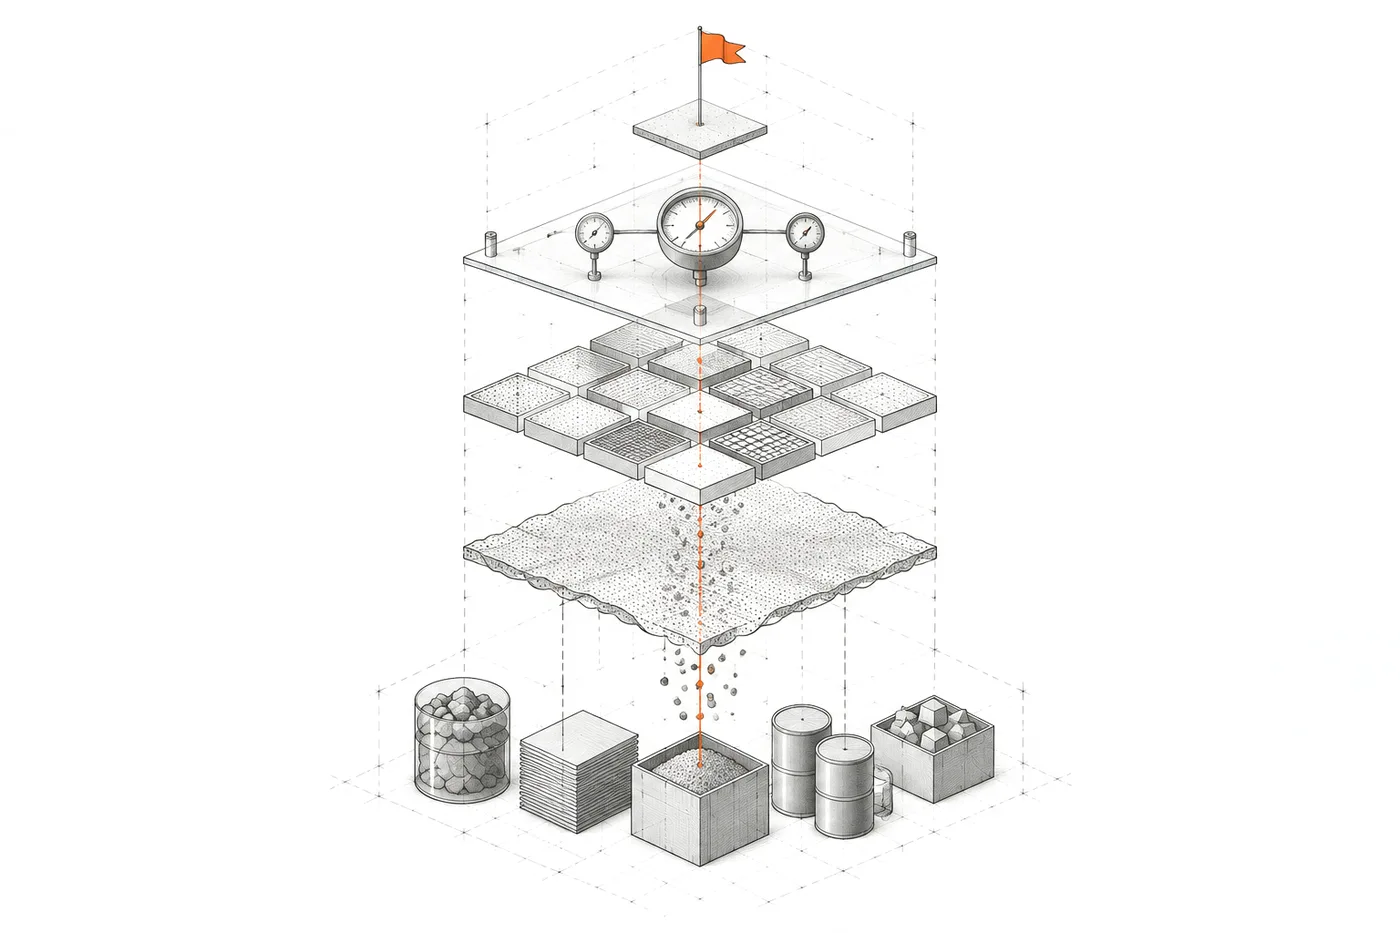
FIG. 03From the sources to the decision, layer by layer
Vertical layered section: different data sources at the base, a filtering layer, a grid of ordered cells, an indicator layer and a decision flag on top, joined by an orange line

04 / FIT

When custom BI makes sense.

When the answer requires knowing your data better than a generic tool does.

Building makes sense if…

  • Your data lives in several systems and the answer you need requires combining them with your own business rules.
  • The data exists but has traps (late entries, repurposed fields, half-closed periods) that a direct chart would turn into false figures.
  • You need the system to detect what needs attention on its own and show the evidence, not just draw it.
  • You want to ask your data questions without exposing it or putting the source system at risk.

05 / POWER BI

Power BI consultant: when yes and when no.

Power BI is a good tool and often the right choice. Power BI consulting makes sense when the data is already in order; if it isn’t, the problem lies underneath.

Power BI is enough if…

  • The data is already in order in one or two sources with clear definitions.
  • The questions are standard: sales by period, by customer, by product.
  • Your company already works with Microsoft 365 and someone on the team can maintain the reports.
  • What you need is good report design, not business logic of your own.

You need your own data layer if…

  • The data has traps (late entries, repurposed fields, half-closed periods) that must be solved before anything is drawn.
  • The logic is your own: comparisons at the same logging cut-off, alerts with evidence or prioritised actions.
  • The result has to live inside a tool the team already uses, not in another application.
  • You want a report that arrives ready every morning, not a dashboard someone has to open.

06 / WHAT I BUILD

What I’d build on your data.

From source to decision, in layers. Each one can be verified on its own.

  • 01

    Source integration

    Read-only connection to the ERP or management system’s database, plus APIs or spreadsheets when the answer needs them. Read before migrating.

    EvidenceAtalayaIQ

  • 02

    Verified definitions

    A data contract: what each table contains, what each field means (checked against reality) and with what caveats it’s used.

    EvidenceAtalayaIQ

  • 03

    Metrics you can defend

    Every indicator with its formula, its period and its coverage. If a figure is partial, the system says what it covers.

    EvidenceAtalayaIQ

  • 04

    Alerts with evidence

    Deterministic, documented rules that flag anomalies and show the records that triggered them.

    EvidenceAtalayaIQ

  • 05

    Reports that write themselves

    A daily and a weekly report with what matters and a prioritised action plan, instead of assembling them by hand.

    EvidenceAtalayaIQ

  • 06

    AI over the data, when it helps

    An assistant that answers questions about the report by choosing queries from a closed catalogue. It comes last, once the data layer is reliable.

    EvidenceAtalayaIQ

    AI with bounded access

07 / ARCHITECTURE

Five layers between your data and a decision.

Skipping a layer is the fastest way to a good-looking dashboard with a wrong figure.

FIG. 07Sources → data layer → definitions → intelligence → decision
  1. 01 — SOURCES

    Sources

    What already exists, read where it lives.

    • ERP
    • CRM
    • MYSQL
    • EXCEL
    • APIS
  2. 02 — DATA LAYER

    Data layer

    Read-only access, bounded queries and periods in your time zone.

    • READ-ONLY
  3. 03 — DEFINITIONS

    Definitions

    What each field means and what can’t be claimed with it.

    • DATA CONTRACT
  4. 04 — INTELLIGENCE

    Intelligence

    Metrics, fair comparisons, alerts and reports.

    • METRICS
    • RULES
    • AI
  5. 05 — DECISION

    Decision

    What to do today, with the evidence alongside.

    • BRIEFING
    • ACTIONS

08 / EVIDENCE

Seven years of operational data, read carefully.

A national events company with its activity in its own system on MySQL. AtalayaIQ reads it without migrating or writing anything.

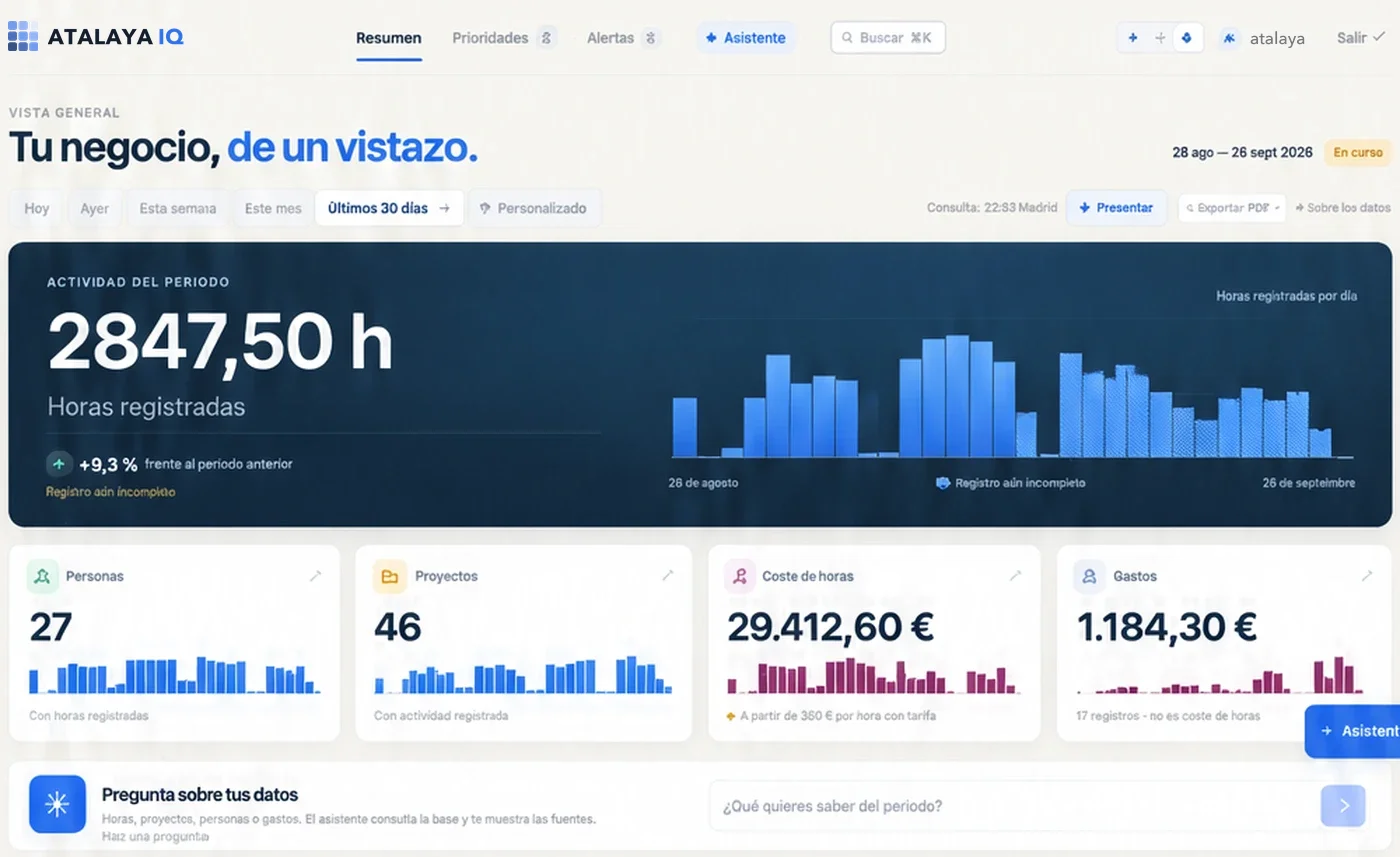
AtalayaIQ overview: hours logged over the last 30 days with their daily series, people, projects, labour cost and expenses.
Overview · last 30 days

Business intelligence

AtalayaIQ

Business Intelligence on a production MySQL database: verified definitions, independent reconciliation and zero writes to the original system.

  • A data contract with the verified meaning and caveats of every table.
  • Comparisons at the same logging delay, so a half-logged day is never mistaken for a drop.
  • Periods in Madrid time, tested against the 23- and 25-hour days.
  • Hours, costs and findings reconciled with hand-written SQL; 36 automated tests.
  • Budget, margin and revenue excluded by design: the database doesn’t contain the data to calculate them.

STACK Nuxt / Vue / MySQL

Case study: AtalayaIQ
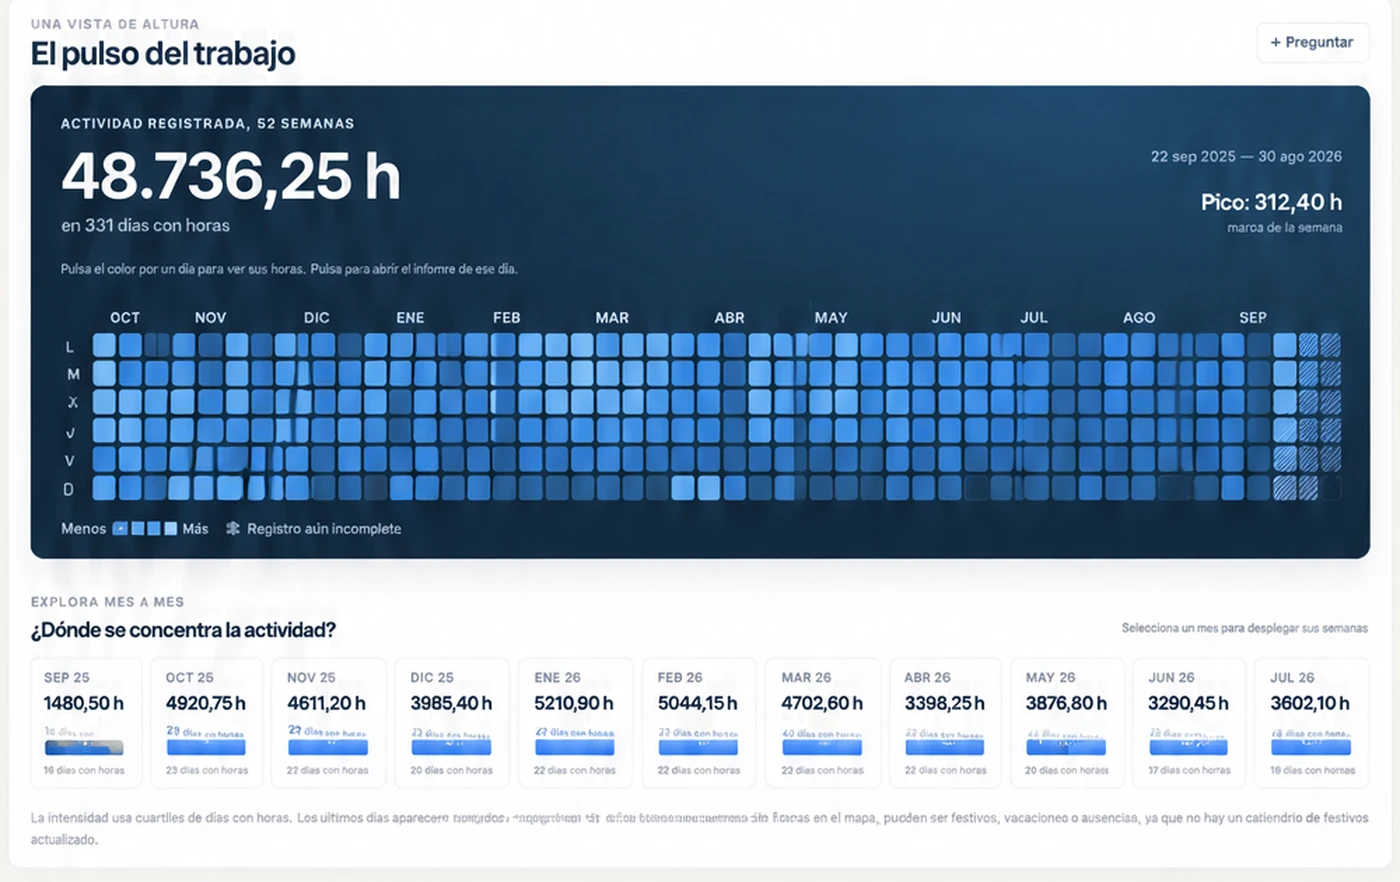
AtalayaIQ heat map with a year of hours logged per day and the monthly distribution of activity.
The pulse of work · a year of records
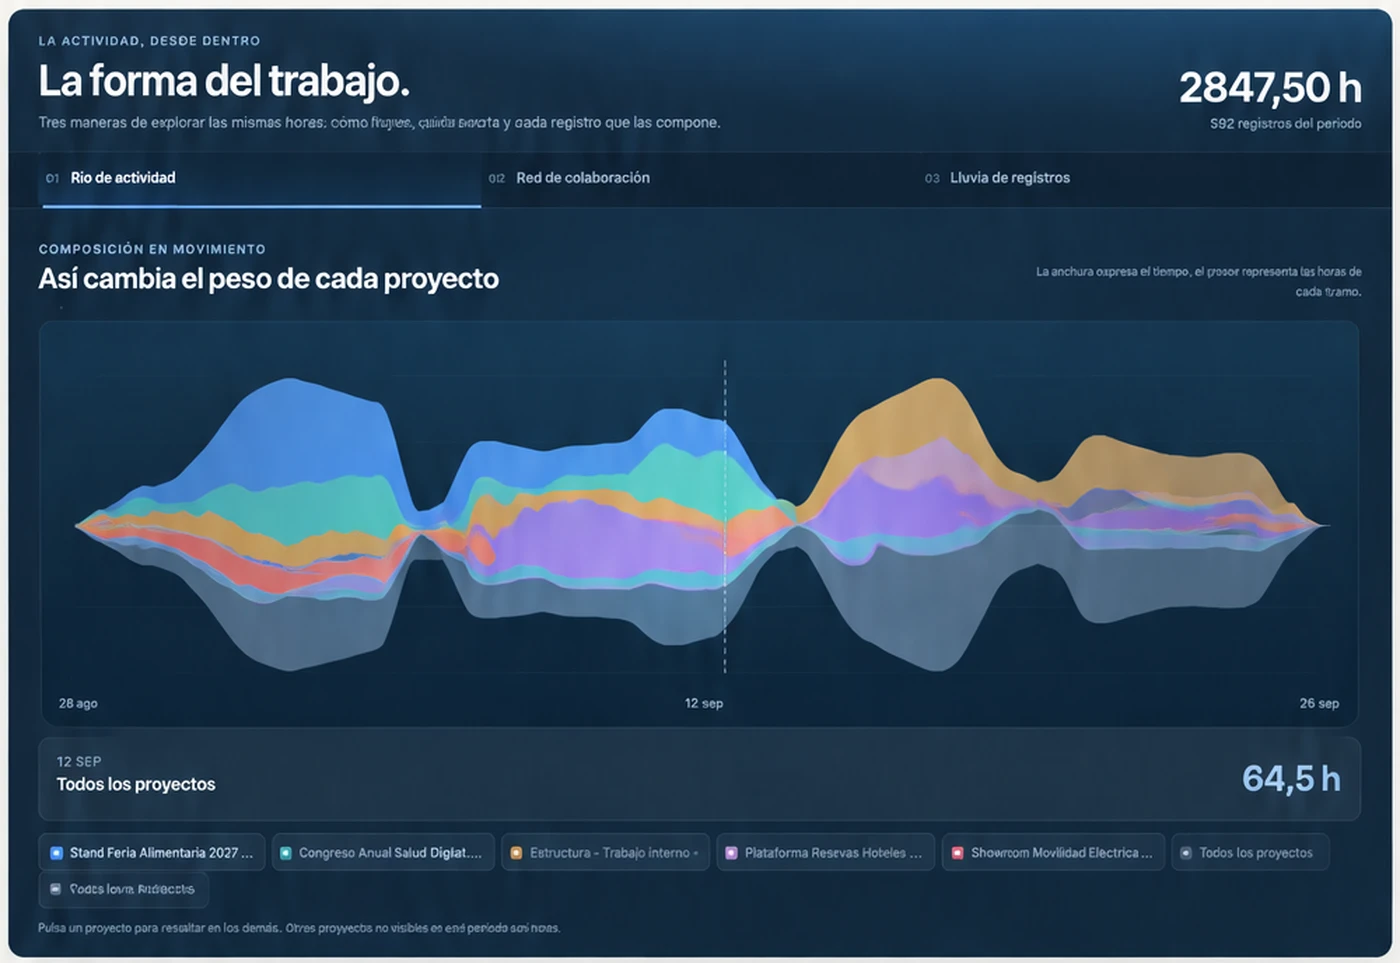
AtalayaIQ stream chart showing how the weight of each project changes over the period.
The shape of work · each project’s weight over time

09 / DON'T BUILD

What NOT to do with a company’s data.

The most expensive mistake isn’t having no BI. It’s having one nobody should believe.

Better not to start here if…

  • Building dashboards on top of data whose meaning hasn’t been defined yet: the chart inherits the ambiguity and makes it look true.
  • Your data is already clean in a single source and the questions are standard: Power BI or Looker Studio will get there faster.
  • What’s missing isn’t analysis but capture: if the data isn’t recorded, no BI will find it.
  • You’re after forecasts or margins your data doesn’t contain. They can be estimated, but shouldn’t be presented as facts.

10 / QUESTIONS

Questions about custom Business Intelligence.

01

What is custom Business Intelligence?

A system that turns your company’s data into answers, designed around your sources and your definitions: what counts as a cost, an active project or a delay. It isn’t a licence for a BI tool, although it can use one if it fits.

02

Do you work as a Power BI consultant?

Yes, when Power BI is the right tool: I design the data model, the definitions and the reports, and leave your team able to maintain them. If the business logic doesn’t fit in Power BI or the problem is in the source data, I’ll tell you and propose a data layer of your own.

A Power BI dashboard management actually uses
03

How is it different from a dashboard?

The dashboard is the screen. Business Intelligence is everything underneath: integration, definitions, rules, reconciliation and alerts. A good dashboard needs that layer; a complete BI may need hardly any screens if it delivers a daily report.

Custom KPI dashboards
04

Do we have to migrate the data into a data warehouse?

Not always. AtalayaIQ reads directly from the database of the system the company already used, with a read-only user. A separate warehouse makes sense when there are many sources or the queries weigh too heavily on the original system.

How to implement Business Intelligence, step by step
05

How do I know the figures are right?

Because they’re reconciled against the source with an independent method. In AtalayaIQ, hours, costs and findings were checked with hand-written SQL, and each day is compared with the previous day of the same type at the same logging delay.

06

Where does artificial intelligence come in?

At the end, and only if it helps. In AtalayaIQ the alerts come from seven deterministic rules; the AI answers questions about the report with a closed catalogue of queries and doesn’t write SQL.

11 / SAME SYSTEM

Related systems.

A business problem rarely lives in a single piece. These usually appear in the same project.

All systems

What would you know about your company if you could trust your data?

Tell me which systems you use, where the data lives and which management question takes too long to answer.